Ripple Effect Charts: Predicting Chain Reactions in Physics-Based Puzzle Environments
Written by Otto Krause · Jun 30, 2026
Ripple Effect Charts: Predicting Chain Reactions in Physics-Based Puzzle Environments
Physics-based puzzle environments rely on interconnected systems where small initial actions trigger extended sequences of movement, collision, and transformation, and ripple effect charts provide structured visual models that map these potential progressions in advance. Developers and players apply these charts to anticipate outcomes in games that simulate gravity, momentum, and material interactions without relying on random chance or scripted events alone.
Core Mechanics Behind Ripple Effect Mapping
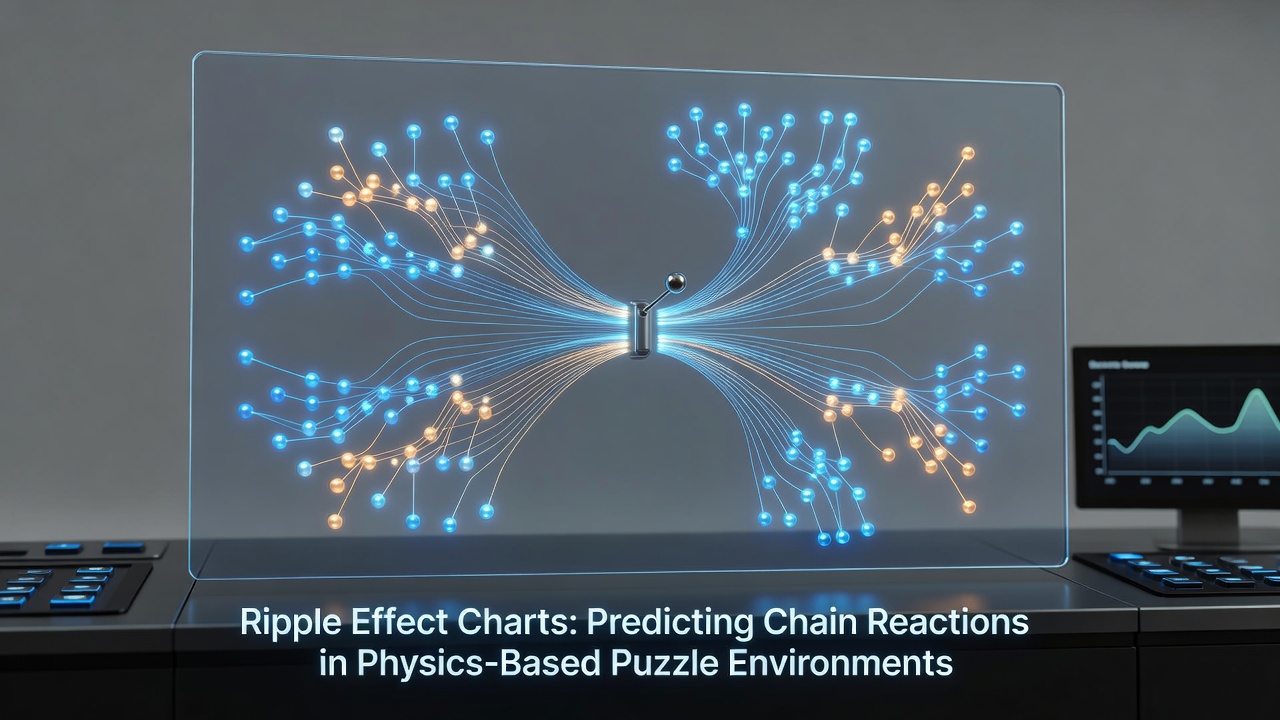
Each chart begins with a central node that represents the first point of interaction, such as a falling block or activated lever, then branches outward through connected elements using vectors that indicate direction, force magnitude, and timing intervals. Data from simulation engines supplies the precise values for these vectors, allowing charts to incorporate variables like friction coefficients and elasticity ratings that differ across object types. Observers note that effective charts separate primary reactions from secondary echoes, where one collision feeds into another only after a measurable delay calculated from object mass and velocity at impact.
Game engines record these interactions during test runs to populate chart databases, and updates in June 2026 are expected to refine synchronization between real-time physics solvers and pre-rendered prediction layers across multiple development platforms. This integration lets designers adjust environmental parameters while seeing updated ripple projections without restarting entire simulation sequences.
Implementation in Popular Puzzle Titles
Titles built around contraption assembly demonstrate clear uses for ripple charts when players must align gears, ramps, and counterweights to produce a final goal state. Charts help isolate failure points where energy dissipates before reaching the target, and teams have documented cases where adjusting a single joint angle altered downstream reaction timing by several frames. Those who study these systems report that color-coded layers within the charts distinguish between reversible and irreversible reactions, giving builders immediate feedback on which components can be repositioned without breaking the overall chain.
One documented example involves a multi-stage water flow puzzle in which an initial valve release must fill several containers in sequence before a buoyancy trigger activates a gate. Ripple charts plotted the flow rates against container capacities and revealed that overflow at an intermediate stage would cancel the final trigger, prompting redesign of overflow channels before level release.
Analytical Tools and Data Sources
Specialized software overlays ripple charts directly onto level editors, pulling live data from physics APIs to recalculate branches whenever object properties change. Research from the University of Melbourne's game simulation laboratory has examined how these overlays reduce iteration cycles during level construction, with figures showing average completion time for complex chain puzzles dropping when prediction layers remain visible throughout the design process. A separate industry report issued by the European Games Developer Federation highlights adoption rates of similar charting tools among studios focused on sandbox physics titles, noting consistent integration with version control systems that track chart revisions alongside level files.
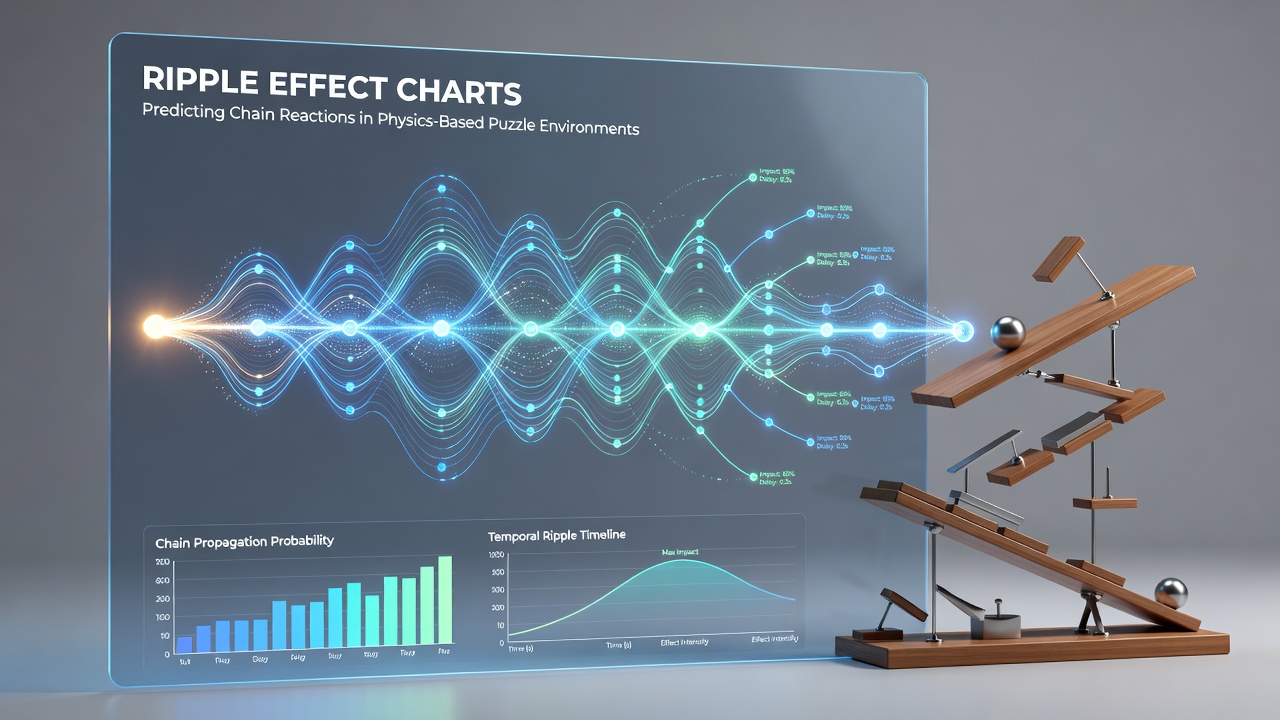
Chart accuracy depends on calibration against actual engine output, and discrepancies often appear at points where multiple simultaneous collisions occur. Calibration routines compare predicted sequences against recorded play sessions, then adjust weighting factors for overlapping interactions until deviation stays below acceptable thresholds. This calibration loop repeats whenever new object materials or environmental forces enter the simulation.
Training and Visualization Practices
Teams train new designers to read ripple charts by starting with isolated two-object collisions before introducing full multi-branch diagrams. Visual training modules present simplified charts alongside slowed playback of the corresponding simulation, allowing users to correlate line thickness with force intensity and node spacing with temporal gaps. Advanced sessions incorporate live editing where participants modify chart parameters and immediately observe resulting changes in the running simulation.
Community resources have extended these methods beyond professional studios, with player-created chart templates shared for specific puzzle genres. These templates standardize notation for common elements such as rotating platforms and breakable barriers, enabling faster comparison of solution paths across different user-generated levels.
Conclusion
Ripple effect charts continue to serve as practical instruments for mapping chain reactions in physics-based puzzle environments by converting engine data into readable prediction models. Their use spans initial design phases through final calibration, supported by ongoing refinements in simulation accuracy and visualization tools. As engines evolve and more studios adopt layered prediction systems, the role of these charts in streamlining complex interaction planning remains firmly established across the field.